
Bollinger Bands
How can we use Bollinger Bands to think about a Capitulation Fade trade ?

Disclaimer : Not stock or trading advice
So, we know this from statistics, right ?
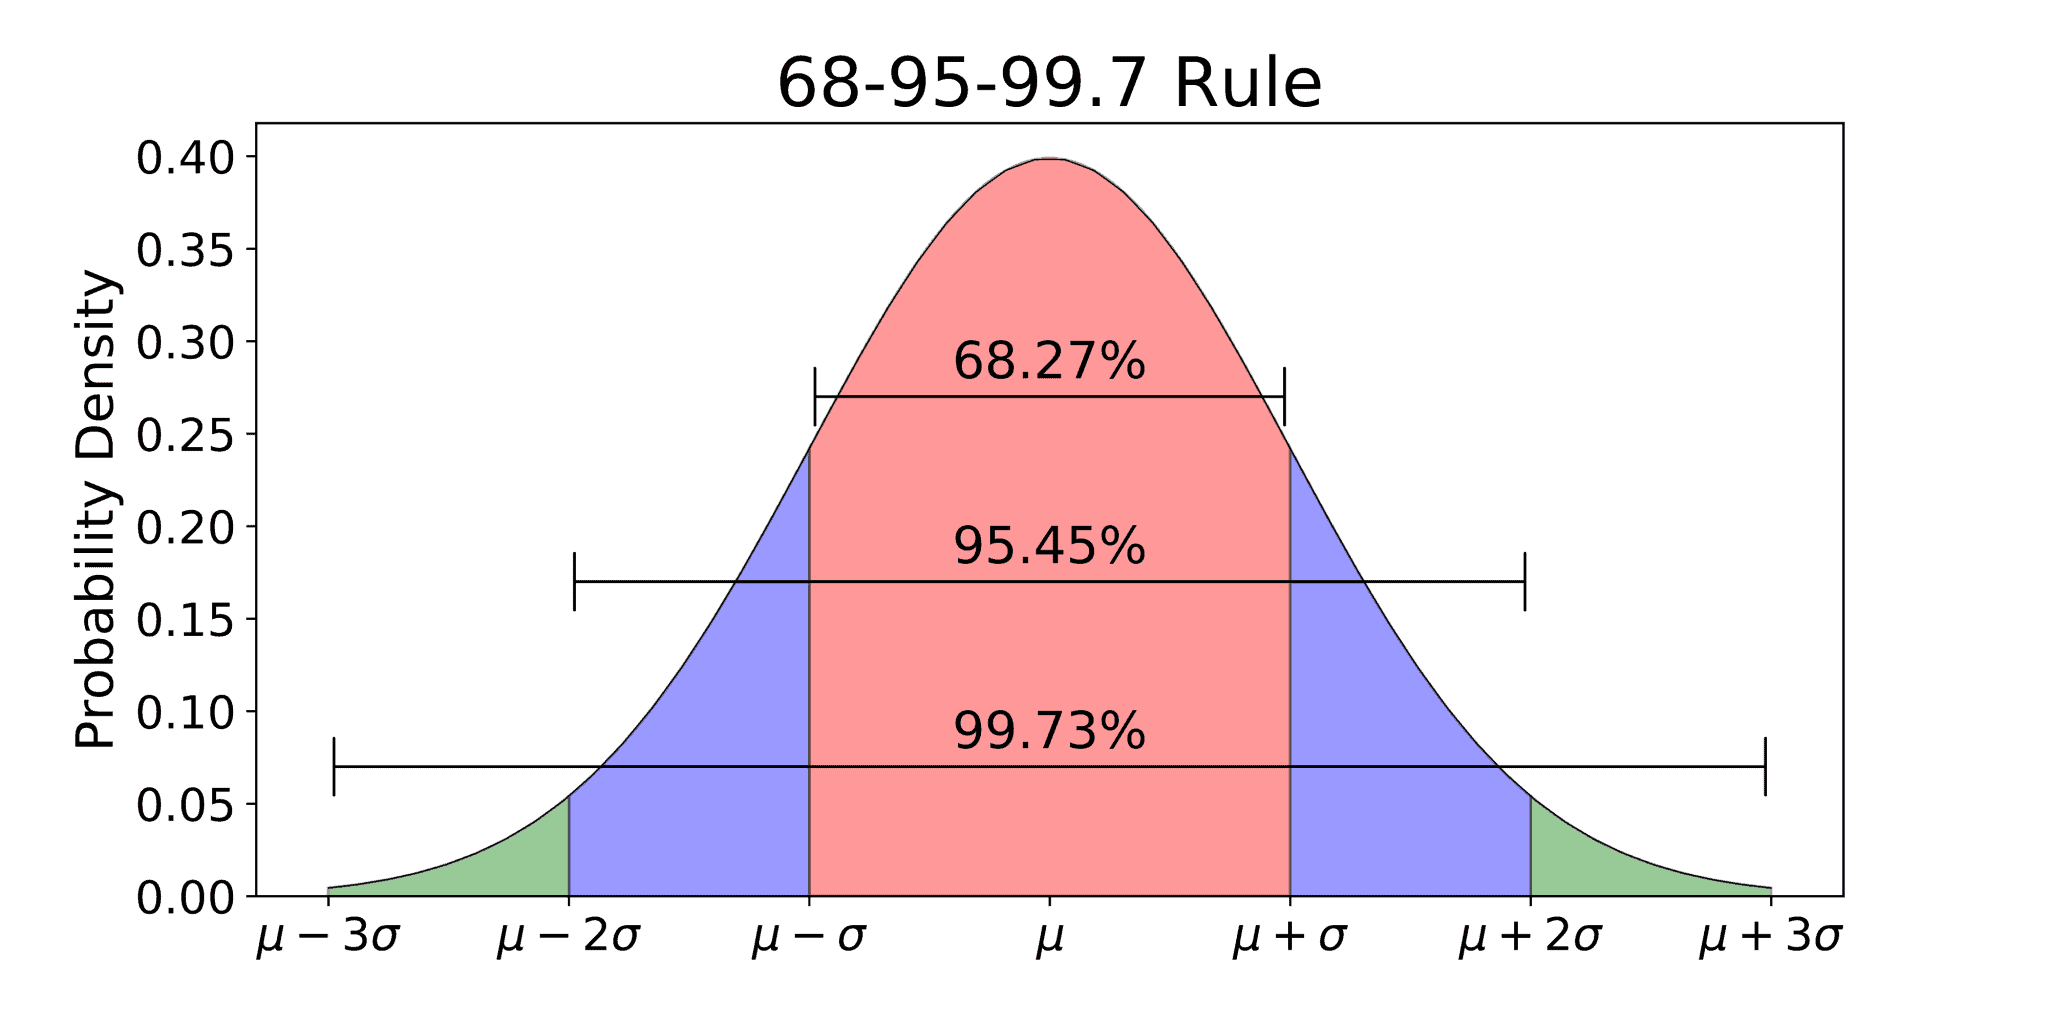
A bell curve has a 67-95-99 formation
Say, if you have a dataset that is normally distributed (the data points approximately, look like a bell curve in a x-y plot),
and, let’s say you take the mean and standard deviation of that dataset, in this case, assume the mean is 10 and the standard deviation is 2
Mean is mu and standard deviation is sigma
So, once you have those defining parameters for the bell curve, 67-95-99 has a meaning to it
It means,
If the entire dataset has 10,000 data points
If you draw samples from this dataset
95% of the time, the samples you draw will likely fall between
mean - (2 x stdev) and mean + (2 x stdev)
In this case, it just means, if you draw 1,000 samples from your 10,000 point dataset, then based on our mean and standard deviation,
95 times out of 100, the samples you draw will fall between
10 - (2 x 2) = 6
and 10 + (2 x 2) = 14
essentially, between 6 and 14
That’s about it, and this is your 95% confidence interval. 95% encompasses two standard deviations from the mean, on each side
For now, don’t worry about things like confidence intervals, let’s apply this intuition directly to a play, it’ll make more sense
You can apply this mathematical foundation to anything, I used to apply this to save the world through energy efficiency policy analytics for a national lab, and increasing yield for a specific route for airlines, in my past
Since most Monte Carlo risk analytics is driven by different probability distribution shapes, you can just take the bell curve and morph it into different shapes, such as triangle, weibull, poisson and binomial - the mu and sigma might change, but the intuition is the same
For a brief moment, forget saving the world and increasing yield for airlines
You can also apply this very intuition to think about a Capitulation Fade
Fade is betting against the continuing trend - you are betting on mean reversion
Capitulation Fade is a type of trading strategy where you identify a specific stock to be over bought, so the price is really high when compared to its mean, and then you are betting on mean reversion
As in, if the price is way high above the mean, you are going to short it, because you expect it to come down to its mean in time
Same intuition on the down side, if its too much below the mean, you expect a spike towards the mean
If the fundamentals of the stock do not change in your time frame (such as earnings calls), then mean reversion is on the cards. If the fundamentals do change, then you are working with a new framework and mean reversion does not hold
It really is immaterial, whether it is climate change and energy math, airlines yield or the stock market,
If you know your foundations, you can apply this to anything
Great
So, just think about the most recent five price points for a stock
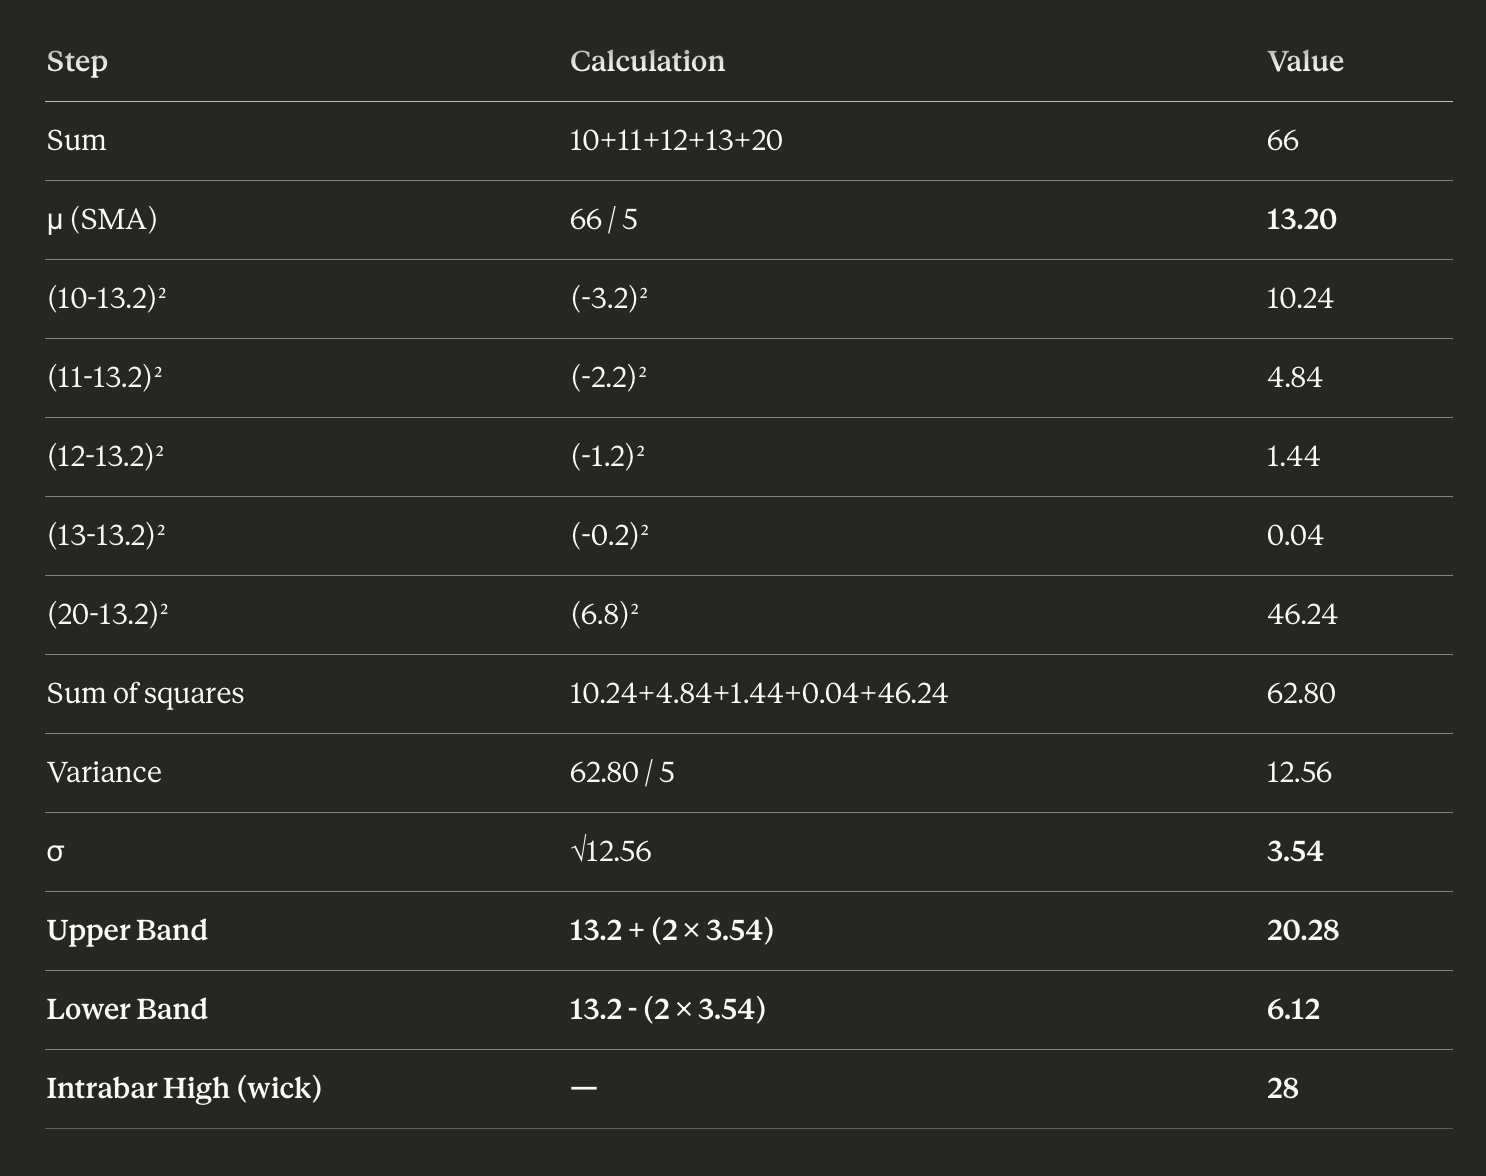
10, 11, 12, 13 and 20 - in this case it is monotonically (always) increasing
In this case, the mean (mu) is 13.2 and the standard deviation (sigma) is 3.54
BTW, thanks Claude !
Same intuition as above,
Mean of 13.2 and stdev of 3.54
The lower band : mean - (2 x stdev) = 13.2 - (2 x 3.54) = 6.12
The upper band : mean + (2 x stdev) = 13.2 + (2 x 3.54) = 20.28
This is your Bollinger band
Mean (essentially, five point moving average) right now is 13.2, with a lower band of 6.1 and an upper band of 20.3
OHLC Candlestick for Share Price
Think about a candle stick for a 5m interval
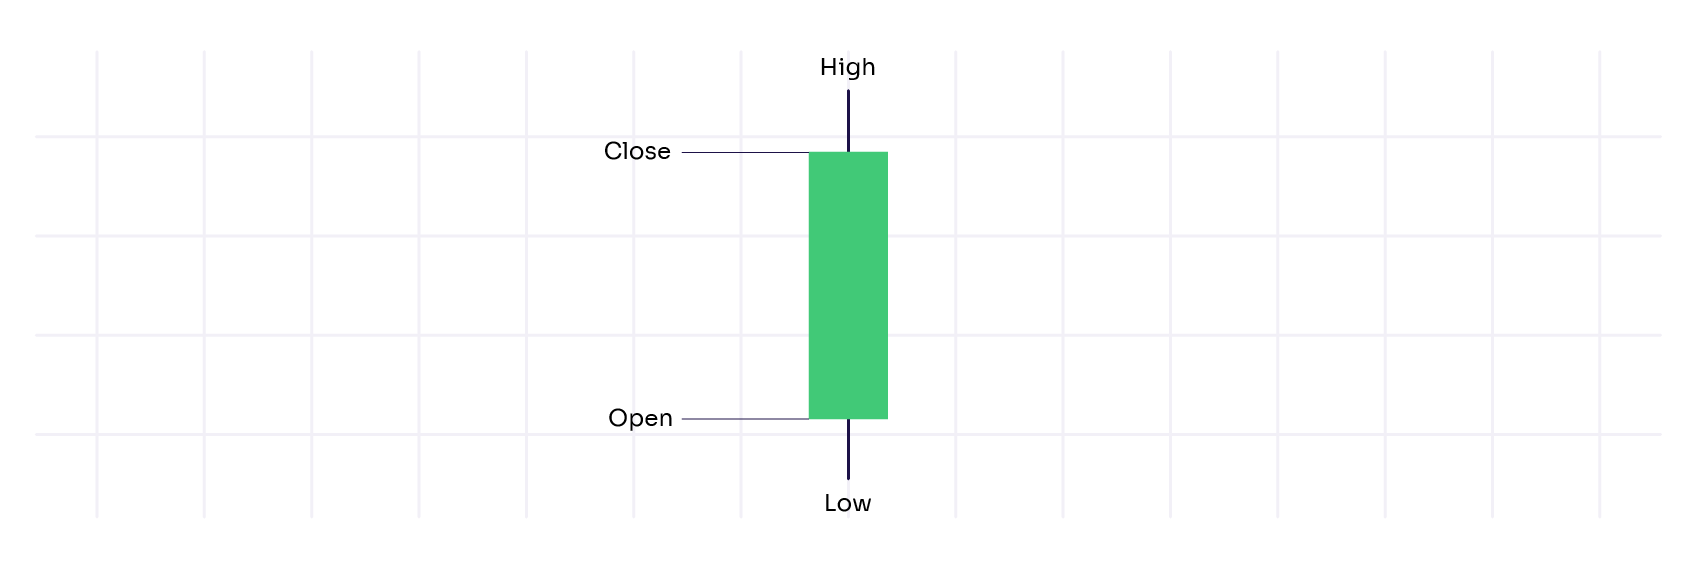
A candlestick shows four things. OHLC, open, high, low and close price, all for that five minute interval during a trading day
That’s it
If you start at a price of 19 and close at a price of 20 within those 5 mins, then that is a green candle because your price increased in those five minutes. But during those five minutes, your price could jump outside the body of the candle as orders get filled
While the price closed at 20 at the end of five minutes the candle represents, someone might have bought the share at a price of 24, which is the higher wick of the candle
So, price could have been as low as 16 and as high as 24 (the low and high are the wicks)
So, in our example, OHLC is
Open 19
Close 20
Low 16
High 24
This is pretty much how candlestick plots work
Yeah ?
Perfect.
As we said above, the Bollinger band ranges between 6.1 and 20.3, and if your highest price in the last five minute interval is at a 24, then you are way about the upper band (20.3)
That’s the driving intuition for a Capitulation Fade
When this happens, you would start thinking about different variables that go into making a capitulation fade trade
There are about ten variables and conditions to think about, but this is the driving intuition of a capitulation fade
Price is way over-extended, and you fade, because you expect a down reversal towards the mean
So, short !
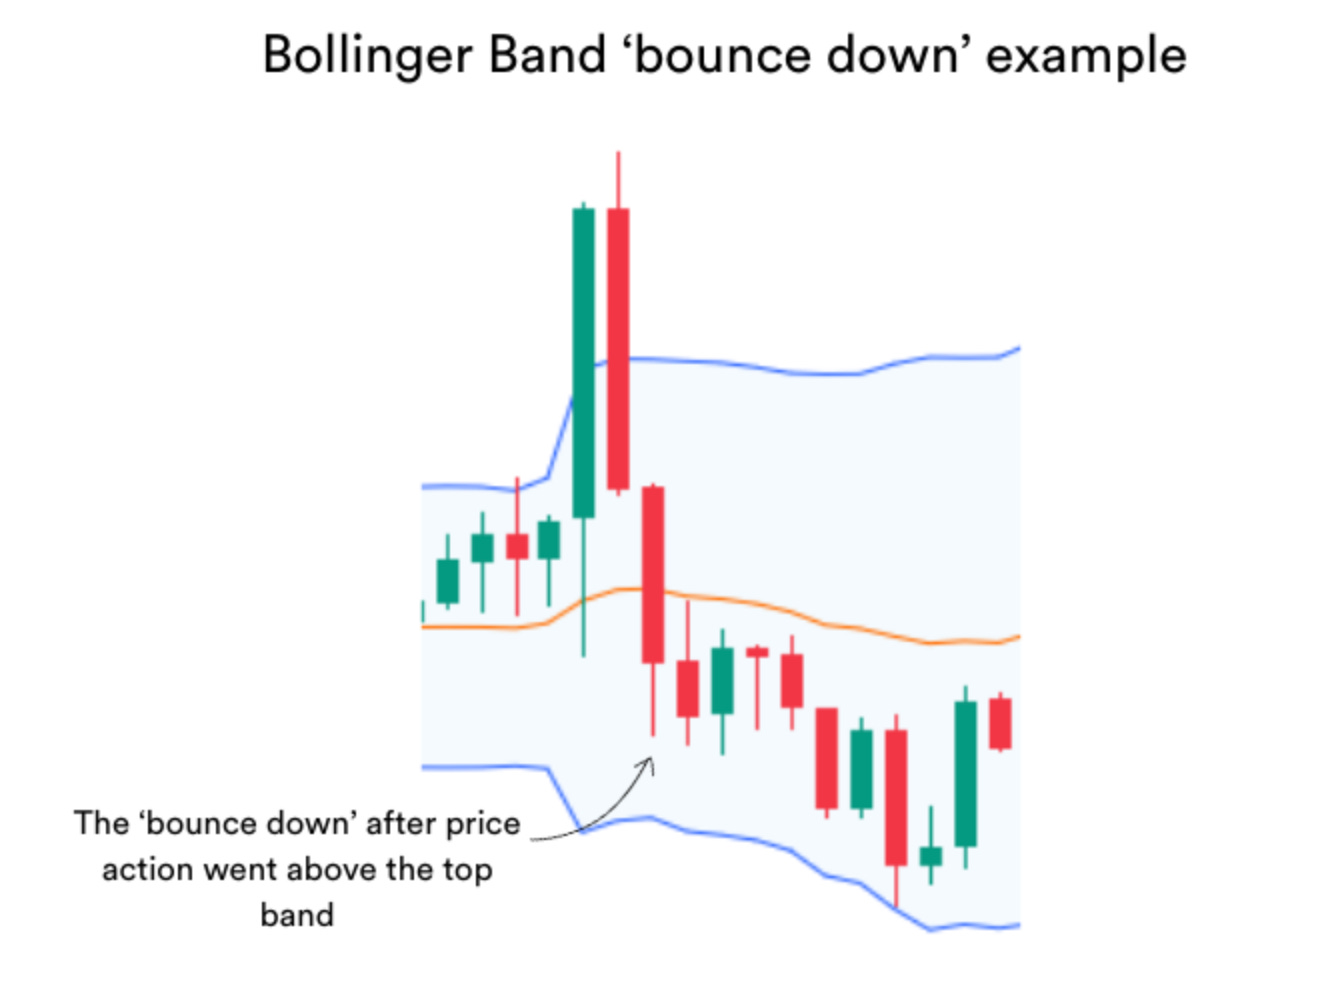
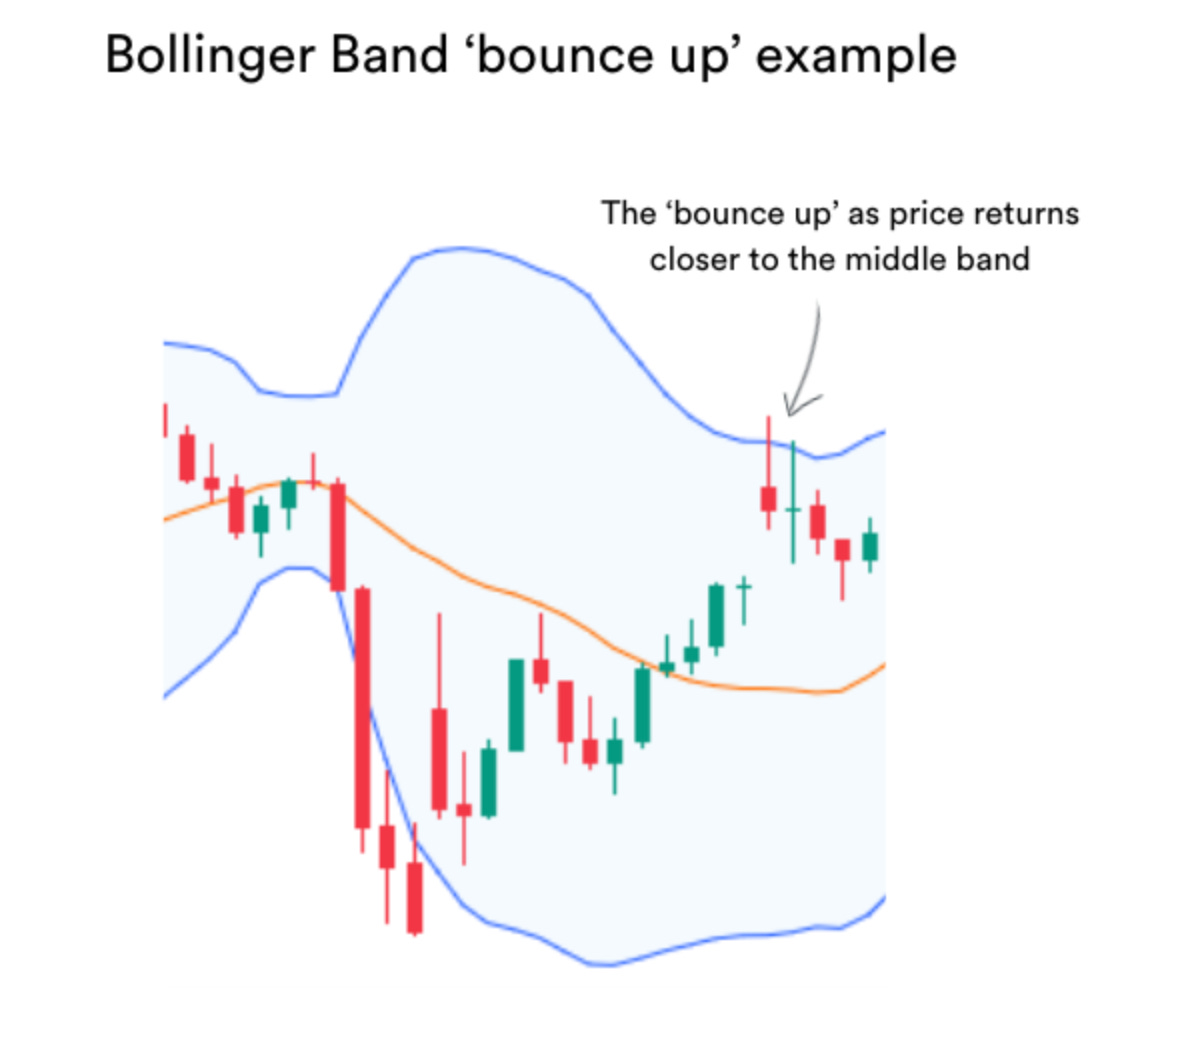
To generalize,
Once price is above the upper band, you can expect a bounce down, and once price is below the lower band, you can expect a bounce up
Short in the first case, and long in the second case
Here is your Bollinger Band Masterclass from one of the best traders on the Street - Lance Breitstein
Last week I attended one of the best proprietary trading summits in New York City, and LB spoke about his tried and tested, Capitulation Fade
This is foundational math and stats,
I’d rather slit my wrist with a butter knife than use pre-packaged, context-devoid, mind numbing numerical expressions for the same application, over and over again for years on end, without understanding foundational math and statistics
… you’ll never find your edge doing that
Application might get you a great annual review, whereas foundation builds careers
Most economists are failed mathematicians, we just forgot to fall out of love with math - even after all was said and done
— Deepak Sivaraman PhD (Axe), adeadcatbounce@gmail.com
This post references publicly available Facebook, Instagram, YouTube, X and TikTok videos for commentary and analysis. All rights belong to their respective owners